Dayton, Ohio Housing Stats Feb. 2025
Housing Stats Compared
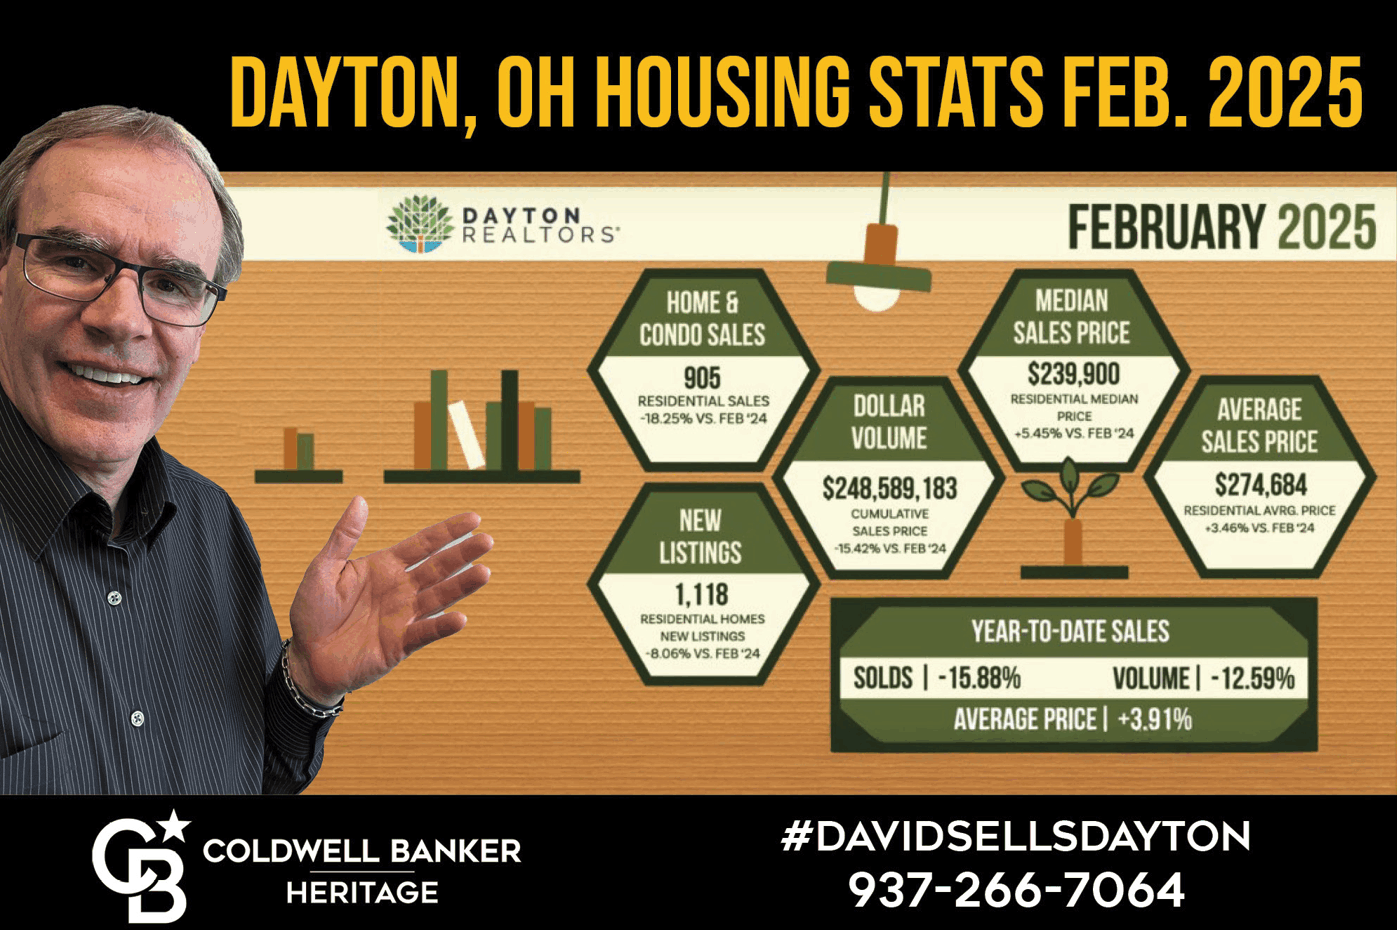
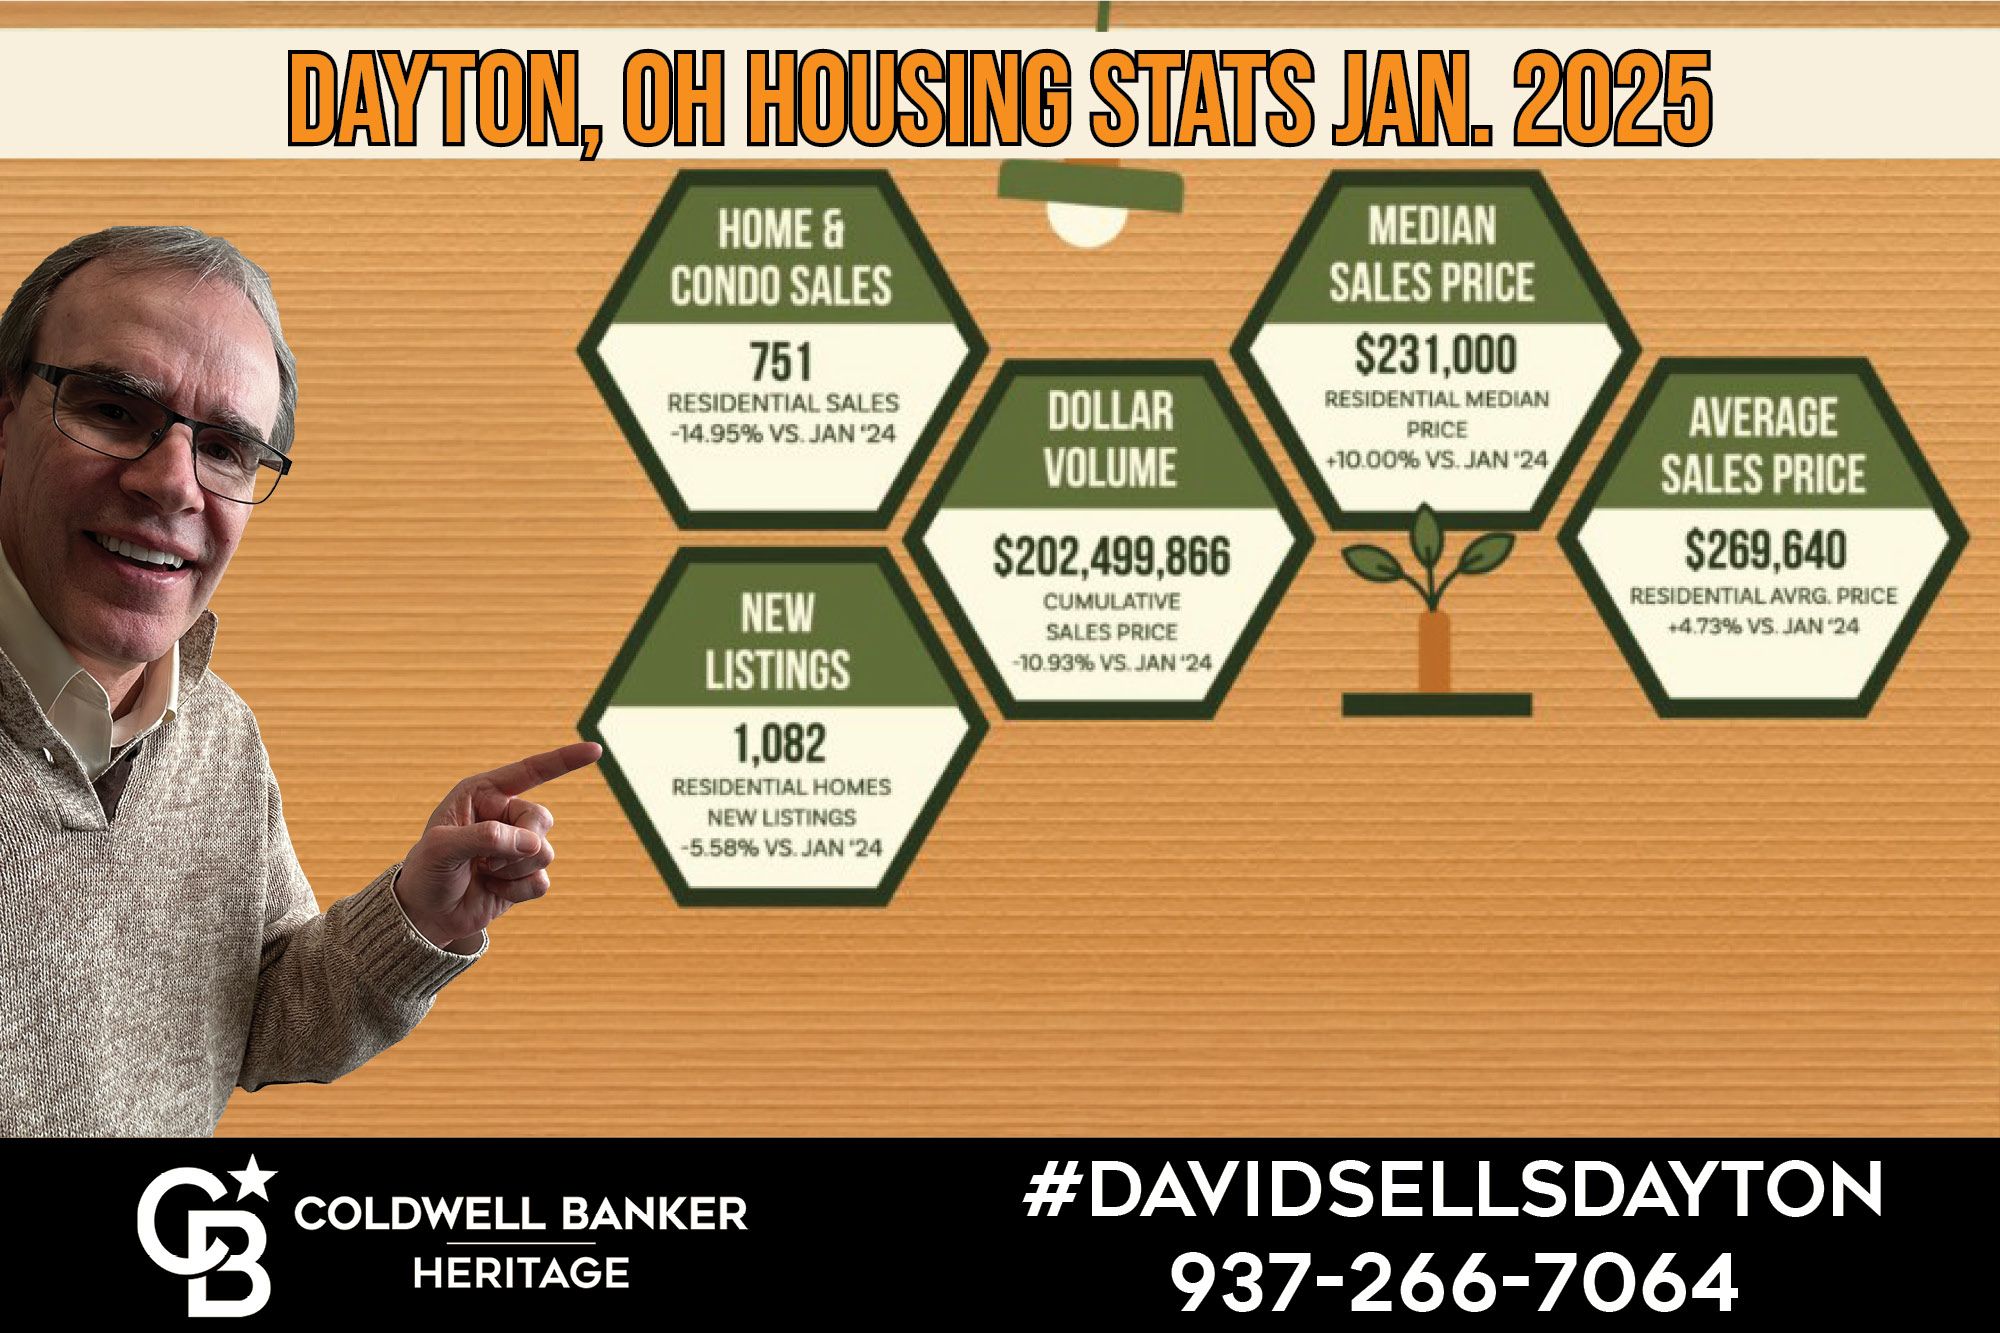
The news is full of national housing statistics. If you are looking to buy or sell a home in Dayton OH then you are most concerned with Dayton’s real estate market. Numbers don’t mean much until you compare. Let’s look at Feb 2024 vs Feb 2025. Home sales down over 18%, a trend I reported on last month for January. New listings coming to the market, down 8% vs Feb 24. As a result of the decreased activity, total dollar volume is down nearly 15.5%.
Still a Seller’s Market?
The bright spot for home sellers is the average sale price has increased about 3.5% and the median sale price up almost 5.5%. Even though most of these numbers are negative, we remain in a Seller’s Market. For the last few years we have been in such a strong Seller’s Market that even with a slip in sales, the market still favors the Seller. Evidence of that is in the continued appreciation we are seeing in prices.
Real Estate Stats for your City
These real estate stats are for all of the Dayton Ohio area. If you want to see how Beavercreek, Centerville, Kettering or any other area stacks up, just reach out and I’ll be happy to get you up to speed on your local real estate market.
Categories
Recent Posts


